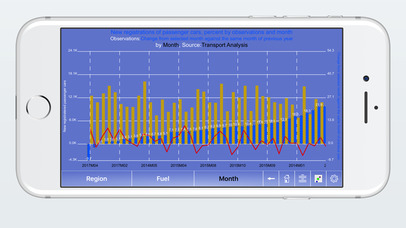
Create and combine graphs, bar, grouped bar, stacked bar and line graphs, from all available sources.
Compare observations from any variable in any table with any other table with some matching variable content.
Save your graphs and queries for later access.
Share and save screenshots of your creations.
The "Explore" function lets you investigate the data behind your collected graphs in a cube (X,Y,Z) fashion.
Choose from 2033 tables/sources distributed and grouped by:
Agriculture, forestry and fishery
Business activities
Democracy
Education and research
Energy
Environment
Financial markets
Household finances
Housing, construction and building
Labour market
Living conditions
National accounts
Population
Prices and Consumption
Public finances
Trade in goods and services
Transport and communications


